Grady's Gradations
Web inspection platform for Grady Inspection
Field beta — web build
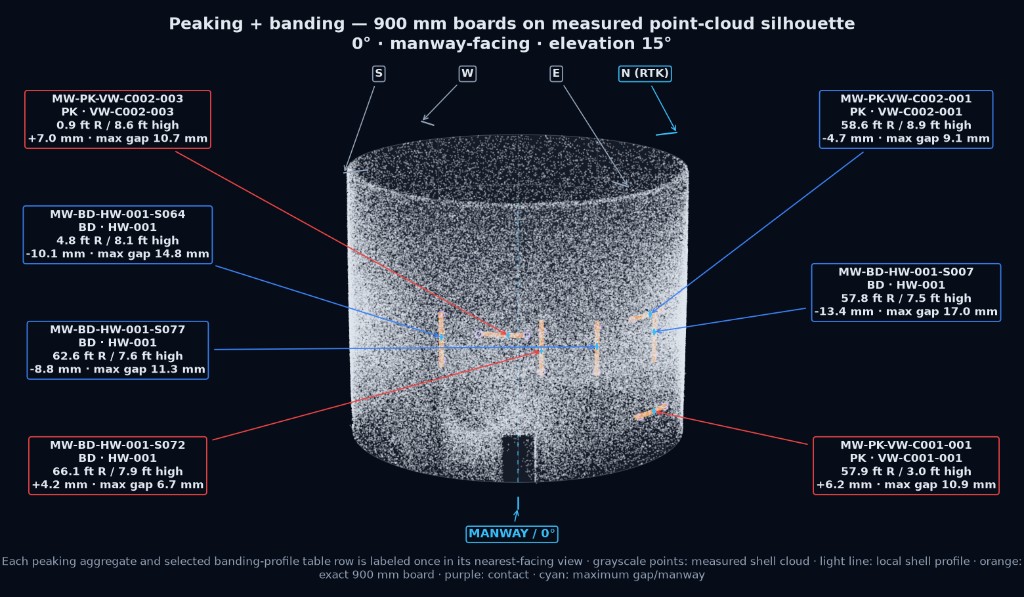
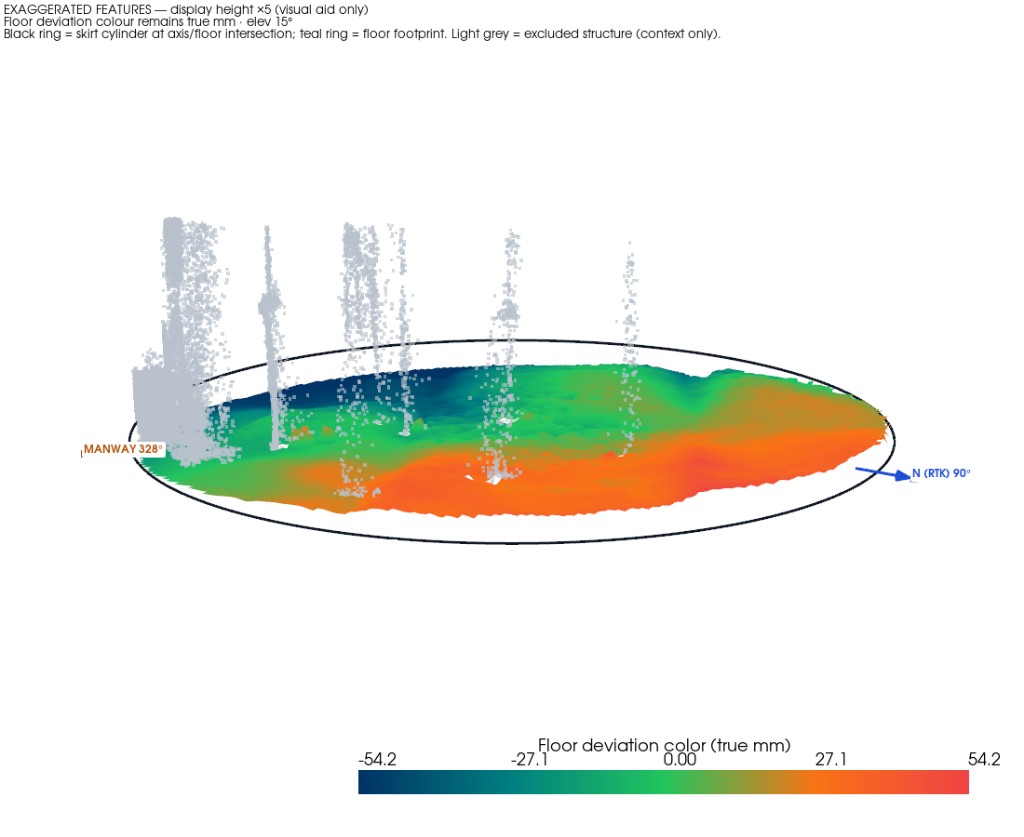
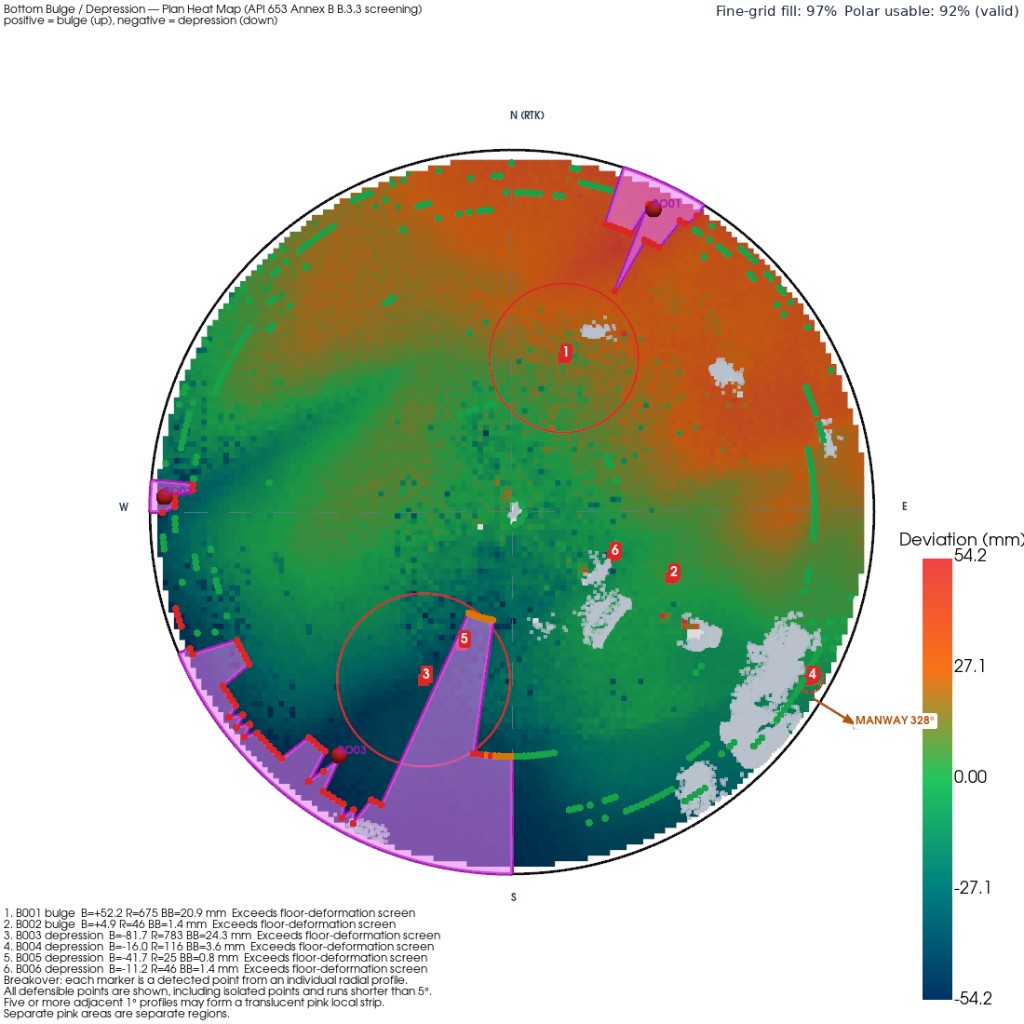
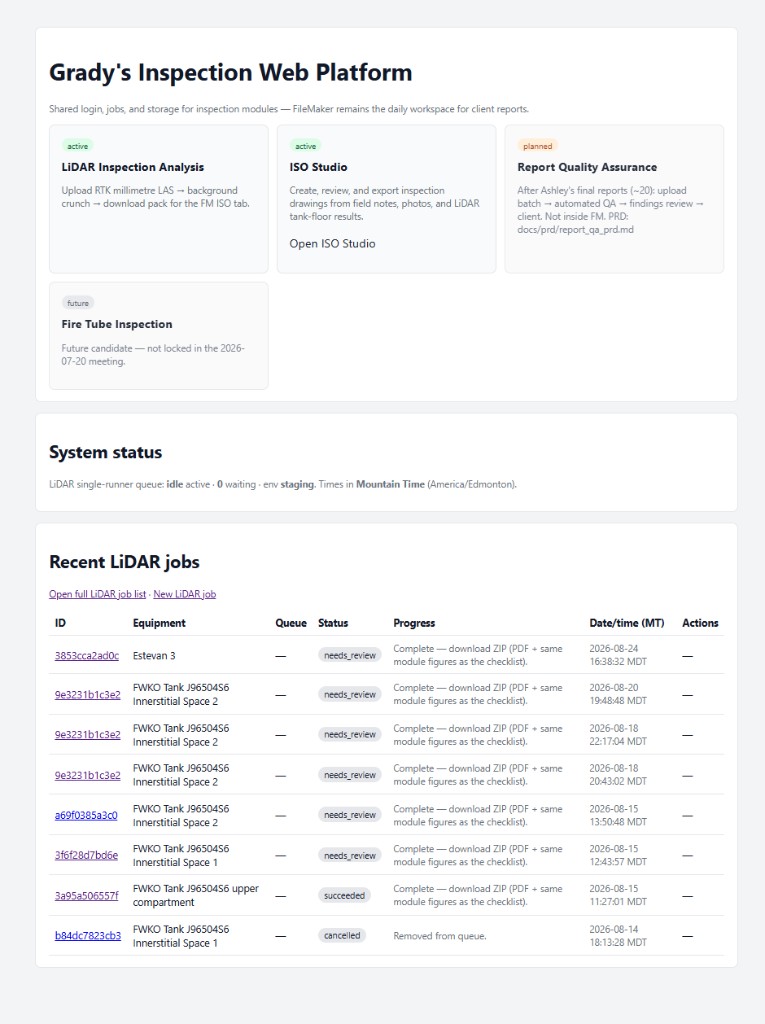
Mithril Consulting is building Grady's Gradations as a web server for Grady Inspection. After a LiDAR job is ingested, the platform runs deterministic calculations and produces inspector-ready pictures: weld topology, peaking, banding, bottom breakover, settlement screening, and more. Operators review the job, then decide what a client sees through a controlled portal — including invitations and an interactive 3D viewer of the inspection results.
These screens and the recording are from the current field-beta web build. They show real jobs, real calculations, and real client-facing output.
Client
Grady Inspection
Visit gradyinspection.com
The Operational Problem
- — Tank inspection work depends on specialized calculations that do not fit generic software
- — LiDAR scans are large, and the office still needs repeatable, auditable results
- — Client reports need clear pictures and a controlled view of findings — not a raw point cloud
The Mithril Approach
- — Ingest the LiDAR job on a shared web platform
- — Run deterministic calculation modules after upload
- — Keep human review in the loop before anything is published
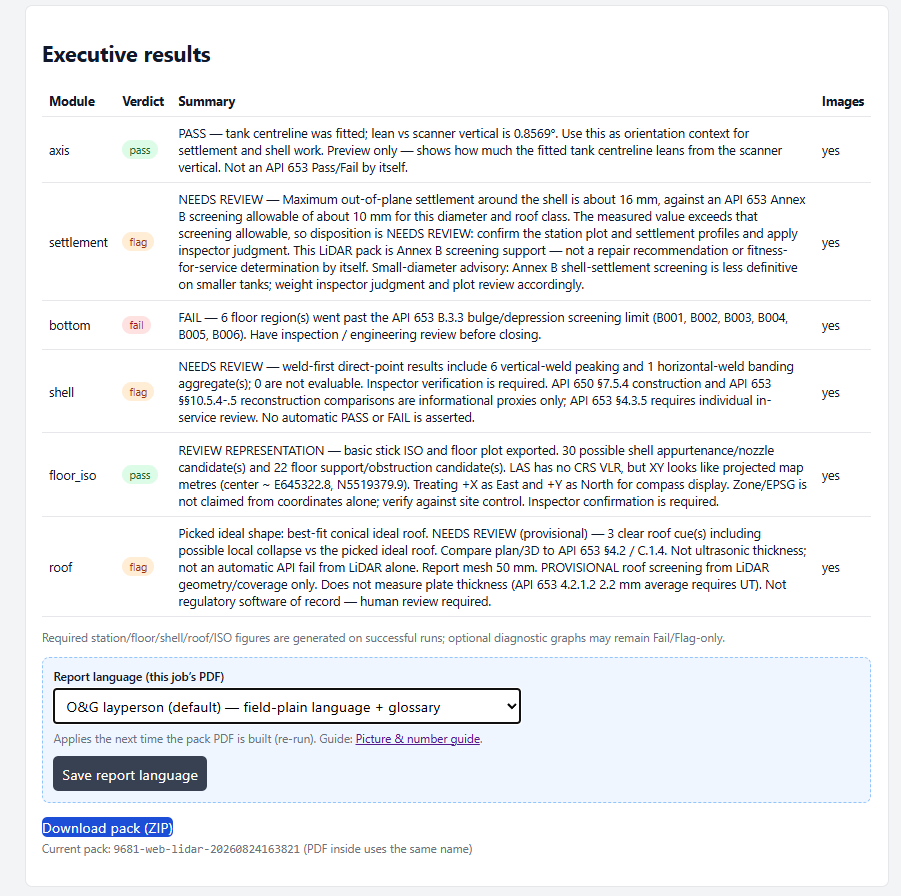
- — Generate inspector-grade figures and a downloadable report pack
- — Let the operator decide what the client sees, including invitations to a portal
Current Stage
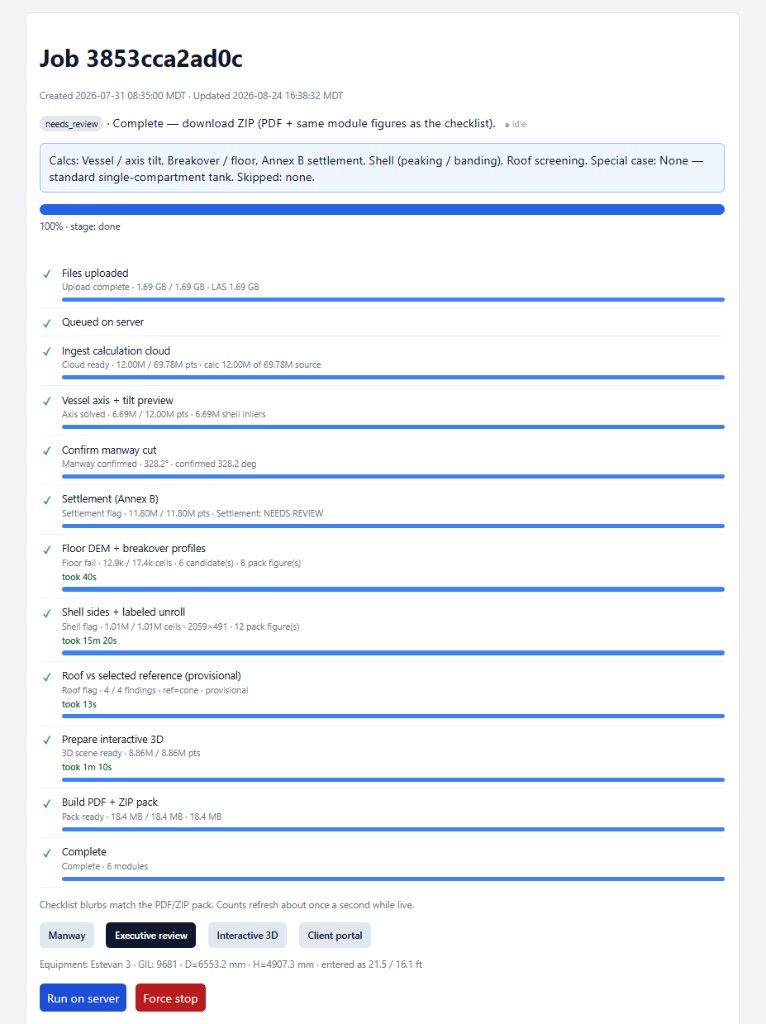
The product is now a web server build in field beta. LiDAR jobs run through a staged pipeline: ingest, vessel axis and tilt, Annex B settlement, floor DEM and breakover, shell peaking and banding, roof screening, then PDF/ZIP pack and interactive 3D.
What the Platform Does
-
LiDAR job ingestion
Upload a scan, queue the job, and track each calculation step on the web platform.
-
Deterministic inspection math
Weld topology, peaking, banding, bottom breakover, settlement screening, and related modules stay explainable and auditable.
-
Client-facing pictures
Heat maps, board figures, and 3D views are generated as inspector-controlled evidence — not marketing mockups.
-
Interactive 3D viewer
Review the measured cloud with inspection results overlaid: floor deviation, shell findings, and related layers.
-
Client portal
The operator chooses what the client sees, sends invitations, and can share a controlled results view.